Trout Roe
Overview
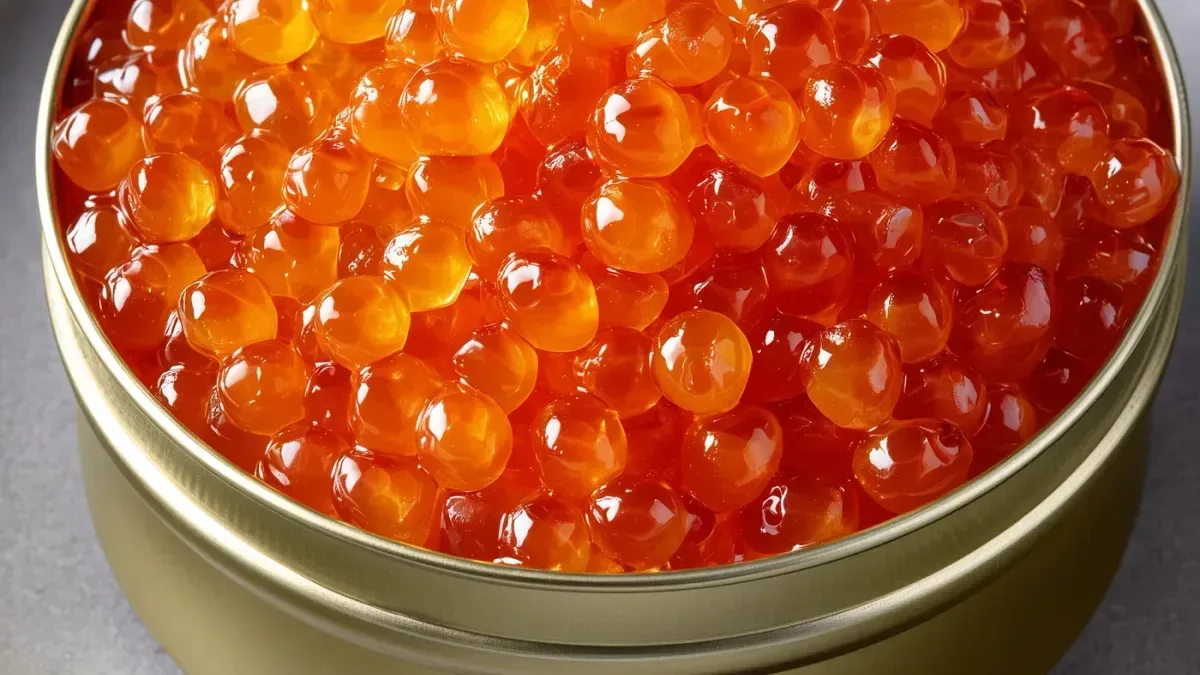
Trout roe comes from rainbow trout (Oncorhynchus mykiss) and related farmed lines. Like salmon roe, it delivers EPA, DHA, and phospholipid-associated fatty acids together with choline and vitamin B12 in a compact matrix. Mechanistic discussions of LPC-associated DHA transport apply to phospholipid-rich seafood matrices generally [1][2].
Within the BRAIN Diet framework, trout roe is best viewed as a mid-tier roe option: it is often less expensive per gram than premium salmon ikura, while still offering strong omega-3 and choline density compared with most land-animal foods. Exact fatty-acid and carotenoid profiles remain product-dependent; species-specific compositional tables should replace the current proxy when available.
Key Nutritional Highlights
- Phospholipid-context omega-3s (EPA/DHA) with very high choline per 100 g (proxy panel).
- Vitamin B12 density is typically high in salmonid roe; values shift by product.
- Usually more accessible pricing than top-grade salmon roe in many markets.
- Farmed trout supply chains vary — quality and freshness still dominate practical value.
- Compositional data here use a USDA mixed-roe proxy until a trout-roe FDC record is wired in.
Food Context
Synergies
- Works well as a garnish on whole grains, vegetables, or mild fish to spread flavour without large sodium loads (unlike heavily salted caviar substitutes).
Sourcing
- Farmed trout roe is common; look for clear labelling, cold-chain handling, and use-by guidance.
- Colour can range from orange to amber depending on pigment inputs — not a sole quality indicator.
Preparation
- Serve cold or lightly warmed like other roe; minimise heat and air exposure to protect unsaturated fats.
Essential Amino Acid Profile
This food provides a complete essential amino acid profile typical of animal proteins.
Recipes
Nutrient Tables (per 100 g)
Core nutrients
| Nutrient | Amount per 100 g | % RDA per 100 g |
|---|---|---|
| Energy | 143 kcal | — |
| Protein | 22.3 g | — |
| Total fat | 6.4 g | — |
| Saturated fat | 1.5 g | — |
| Carbohydrates | 1.5 g | — |
| Fibre | 0 g | — |
Key micronutrients
| Nutrient | Amount per 100 g | % RDA per 100 g |
|---|---|---|
| Iron | 0.6 mg | 3.3% |
| Zinc | 1 mg | 9.1% |
| Magnesium | 20 mg | 4.8% |
| Selenium | 40.3 µg | 73.3% |
| Calcium | 22 mg | 2.2% |
| Potassium | 221 mg | 6.5% |
| Choline | 335.4 mg | 61% |
| Folate | 80 µg | 20% |
| Vitamin B12 | 17 µg | 708.3% |
| Vitamin B6 | 0.2 mg | 9.4% |
Bioactive compounds
Values below are often from specialist compositional databases or literature, not the standard USDA panel. Asterisks (*) refer to source notes at the bottom of this section.
| Compound / class | Amount per 100 g | Notes |
|---|---|---|
| ALA | 1428 mg | — |
| EPA | 983 mg | — |
| DHA | 1363 mg | — |
| Astaxanthin | 2.5 mg * | Present in salmonid roe; farmed trout pigment varies with feed carotenoids. |
Note: Bioactive-compound values vary substantially by cultivar, species, cocoa or oil percentage, processing, and brand formulation. Show quantitative values only where a defensible source exists; otherwise prefer qualitative presence statements or ranges in source notes.
- * Astaxanthin: Order-of-magnitude literature estimate; not on the proxy FDC record; farmed trout roe can be lighter than salmon ikura.
Substances
Substances in this food: editorial (Overview / literature) plus analytical (nutrition table).
15 substances in this food
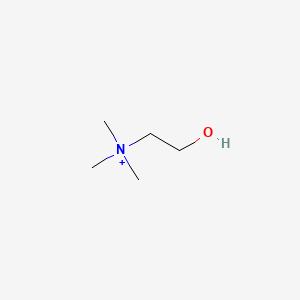
Choline
Acetylcholine precursor; methyl donor; phospholipid synthesis for membranes
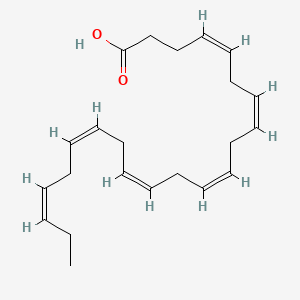
DHA (Docosahexaenoic Acid)
Accounts for ~10–15% of total brain fatty acids, 20–30% of neuronal phospholipids (PE, PS), and >90% of brain omega-3 PUFA; critical for membrane fluidity, synaptic vesicle fusion, neurodevelopment
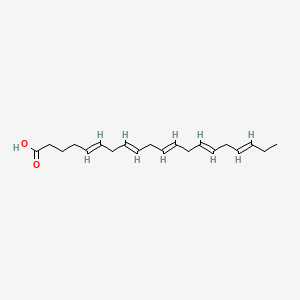
EPA (Eicosapentaenoic Acid)
Potent anti-inflammatory; precursor to E-series resolvins; modulates dopamine and serotonin signalling
Phosphatidylcholine (PC)
Key brain phospholipid; carrier for DHA/EPA and acetylcholine precursor pathway
Iron
Oxygen transport; dopamine synthesis (tyrosine hydroxylase cofactor)
Zinc
Cofactor in neurotransmission and antioxidant enzymes; dopamine modulation
Magnesium
Enzymatic cofactor (>300 reactions); neurotransmitters; mitochondria; redox balance
Selenium
Antioxidant enzyme cofactor (GPx); supports redox balance
Calcium
Bone health; neurotransmission; interacts with vitamin D and K2
Potassium
Electrolyte for nerve transmission, muscle function, and blood pressure regulation
Vitamin B9 (Folate; 5-MTHF)
One-carbon metabolism; methylation; homocysteine recycling
Vitamin B12 (Cobalamin)
Methylation; myelin; mitochondrial odd-chain FA metabolism
Vitamin B6 (Pyridoxine → PLP)
PLP cofactor for neurotransmitter synthesis; relies on brain PDXK activation
ALA (Alpha-Linolenic Acid)
Essential omega-3 precursor; limited conversion to DHA/EPA
Astaxanthin
Lipid-soluble carotenoid that stabilizes omega-3–rich membranes; supports mitochondrial and cellular resilience
References
[1] Patrick 2019 — Role of phosphatidylcholine-DHA and LPC-DHA in brain transport
[2] Liu et al. 2014 — Higher efficacy of phospholipid omega-3 for brain DHA accretion (porcine model)