Peanuts

Overview
Peanuts provide niacin (B3) for NAD+ synthesis, resveratrol (polyphenol), and plant protein supporting mitochondrial function and antioxidant networks. Niacin (Vitamin B₃): Directly converted to NAD+ via salvage pathway; food sources include chicken, turkey, tuna, salmon, mushrooms, peanuts, whole grains.
Within the BRAIN Diet framework, niacin-rich foods (e.g., salmon, chicken breast, turkey, peanuts, and mushrooms) support NAD+ availability, glutathione synthesis, and mitochondrial health .
Key Nutritional Highlights
- Niacin-rich foods (e.g., salmon, chicken breast, turkey, peanuts, and mushrooms) support NAD+ availability, glutathione synthesis, and mitochondrial health.
Food Context
Synergies
- Part of diverse plant protein strategy; dietary diversity (≥30 plant foods per week) supports microbial richness and resilience
- Pair with grains for complete amino acid profile; grain-legume complementarity improves essential amino-acid coverage
Preparation
- Choose dry-roasted or raw over oil-roasted to preserve nutrients and avoid excess omega-6
- Soak to reduce phytates and improve mineral bioavailability
Essential Amino Acid Profile
Peanuts provide a strong plant protein source but are not a complete protein.
Notable amino acids:
- Lysine
Limiting amino acids:
- Methionine and cysteine (DIAAS ~65–70)
Protein pairing strategy:
Peanuts are rich in lysine but relatively low in sulfur-containing amino acids. Combining with grains such as rice, oats, or barley helps create a more balanced essential amino acid profile.
Recipes
Nutrient Tables (per 100 g)
Selected food and preparation: Peanuts, all types, raw. per 100 g edible portion.
Core nutrients
| Nutrient | Amount per 100 g | % reference intake per 100 g |
|---|---|---|
| Energy | 567 kcal | — |
| Protein | 25.8 g | — |
| Total fat | 49.2 g | — |
| Saturated fat | 6.3 g | — |
| Carbohydrates | 16.1 g | — |
| Sugars | 4.7 g | — |
| Fibre | 8.5 g | — |
Key vitamins and minerals
Vitamins and minerals supplying at least 10% of an adult reference intake per 100 g, derived from the composition panel.
| Nutrient | Amount per 100 g | % reference intake per 100 g |
|---|---|---|
| Iron | 4.6 mg | 25.4% |
| Zinc | 3.3 mg | 29.7% |
| Magnesium | 168 mg | 40% |
| Phosphorus | 376 mg | 53.7% |
| Manganese | 1.9 mg | 84.1% |
| Selenium | 7.2 µg | 13.1% |
| Potassium | 705 mg | 20.7% |
| Copper | 1.1 mg | 127.1% |
| Folate | 240 µg | 60% |
| Vitamin B6 | 0.3 mg | 26.8% |
| Vitamin B2 | 0.1 mg | 10.4% |
| Vitamin B1 | 0.6 mg | 53.3% |
| Vitamin B3 | 12.1 mg | 75.4% |
| Vitamin B5 | 1.8 mg | 35.3% |
| Vitamin E | 8.3 mg | 55.5% |
Bioactive compounds
Content applies to the food and preparation identified in the source notes.
| Compound / class | Amount per 100 g | Notes |
|---|---|---|
| Linoleic Acid | 15.6 g | — |
Substances
10 substances in this food
Copper
USDA FoodData Central reports copper in Peanuts, all types, raw.
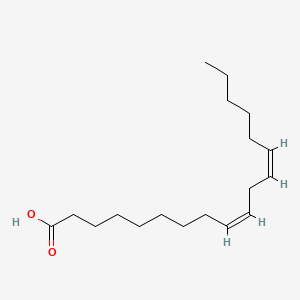
Linoleic Acid (LA, n-6)
USDA FoodData Central reports linoleic acid in Peanuts, all types, raw.
Magnesium
USDA FoodData Central reports magnesium in Peanuts, all types, raw.
Manganese
USDA FoodData Central reports manganese in Peanuts, all types, raw.
Phosphorus (Phosphate)
USDA FoodData Central reports phosphorus in Peanuts, all types, raw.
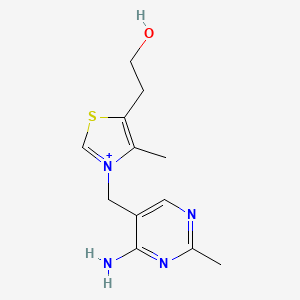
Vitamin B1 (Thiamine)
USDA FoodData Central reports vitamin B1 in Peanuts, all types, raw.
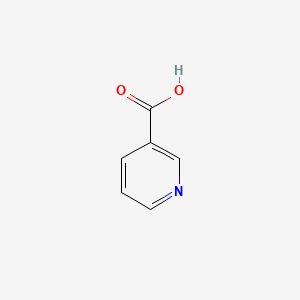
Vitamin B3 (Niacin)
USDA FoodData Central reports vitamin B3 in Peanuts, all types, raw.
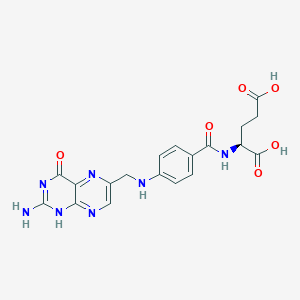
Vitamin B9 (Folate)
USDA FoodData Central reports folate in Peanuts, all types, raw. The recorded analyte is folate.
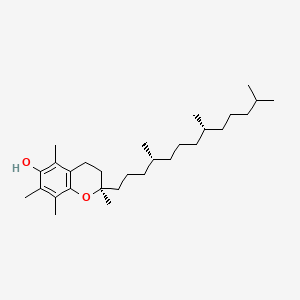
Vitamin E (Tocopherols/Tocotrienols)
USDA FoodData Central reports vitamin E in Peanuts, all types, raw.
Zinc
USDA FoodData Central reports zinc in Peanuts, all types, raw.