Rice

Overview
Rice is a globally used staple carbohydrate. Within the BRAIN Diet, variant and processing often matter more than the word “rice” on a label: degree of milling, pigmentation (white, red, black), cultivar (e.g. basmati vs jasmine), cooking and cooling, fermentation, and meal context (protein, fat, fibre, acidity) shape fibre, resistant starch (RS), glycaemic impact, and polyphenol exposure.
Cooking and cooling can create larger biological differences than minor distinctions between many white-rice cultivars. Red and black rice contribute more meaningfully to antioxidant and polyphenol exposure than small cultivar differences among polished whites.
Grain protein remains lysine-limited; pairing with legumes improves essential amino acid balance [1,2]. Nutrient tables below map to brown rice, cooked as the reference variant; see the comparison table for how other types differ [1][2].
Key Nutritional Highlights
- Reports on dietary Protein Quality Evaluation in Human Nutrition: Report of an FAO Expert Consultation [1]
- Reports on dietary Protein and Amino Acids in Vegetarian Diets—A Review [2]
- Rice is a globally used staple carbohydrate. [1]
- Within the BRAIN Diet, variant and processing often matter more than the word “rice” on a label: degree of milling, pigmentation (white, red, black), cultivar (e.g. [2]
- basmati vs jasmine), cooking and cooling, fermentation, and meal context (protein, fat, fibre, acidity) shape fibre, resistant starch (RS), glycaemic impact, and polyphenol exposure.
- Cooking and cooling can create larger biological differences than minor distinctions between many white-rice cultivars.
Rice Variants and Biologically Relevant Characteristics
| Rice Type | Fibre | Resistant Starch Potential | Glycaemic Impact | Polyphenols | Micronutrient Density | Notes |
|---|---|---|---|---|---|---|
| White Rice | Low | Low (freshly cooked) | Higher | Low | Lower | Most bran removed; primarily starch source. |
| White Rice (Cooked & Cooled) | Low | High | Lower | Low | Lower | Resistant starch formation significantly increased after cooling. |
| Basmati Rice | Low–Moderate | Low–Moderate | Lower than many white rice varieties | Low | Lower | Generally slower glucose appearance than jasmine rice. |
| Jasmine Rice | Low | Low | Higher | Low | Lower | Typically more rapidly digestible than basmati. |
| Brown Rice | Moderate | Moderate | Lower | Moderate | Higher | Bran retained; provides magnesium, manganese and fibre. |
| Red Rice | Moderate | Moderate | Lower | High | Higher | Anthocyanins and polyphenols contribute antioxidant capacity. |
| Black Rice | Moderate | Moderate | Lower | Very High | Higher | Rich source of anthocyanins and antioxidant compounds. |
| Wild Rice* | Higher | Moderate | Lower | Moderate | Higher | Technically a grass seed rather than true rice. |
| Fermented Rice Preparations | Variable | Variable | Lower | Variable | Variable | Fermentation may alter digestibility and microbiome interactions. |
*Not botanically a true rice but often grouped with rice products.
Key Biological Variables
- Degree of milling (white vs brown)
- Pigmentation (white, red, black)
- Cooking and cooling status
- Fermentation status
- Food matrix (whole grain vs flour)
- Meal context (protein, fat, fibre, acidity)
Food Context
Synergies
- Pair with legumes for complete amino acid profile; pair legumes with grains (e.g., beans + rice) to cover lysine and methionine gaps
Preparation
- Cook and cool to increase resistant starch; reheating does not fully reverse RS formed on cooling — cooled (and reheated) white rice showed higher RS and lower glycaemic response than freshly cooked equivalents [3]
- Choose brown, red, or black rice when fibre, minerals, and polyphenols are priorities; choose basmati over jasmine when slower glucose appearance is preferred
- Fermented rice preparations (where used) may differ from standard cooked rice in digestibility and microbiome interactions — treat separately from plain polished white rice
- Cooled rice RS supports fermentable substrate for gut microbes (Bifidobacterium, Akkermansia) and butyrate-associated barrier support
Essential Amino Acid Profile
Rice provides a useful plant protein source but are not a complete protein.
Notable amino acids:
- Methionine (relatively higher than in legumes)
Limiting amino acids:
- Lysine (typical of grains)
Protein pairing strategy:
Grains such as rice are relatively higher in methionine but lysine-limited. Combining with legumes (e.g. lentils, chickpeas) creates a more balanced essential amino acid profile.
Recipes
1 recipe containing this food
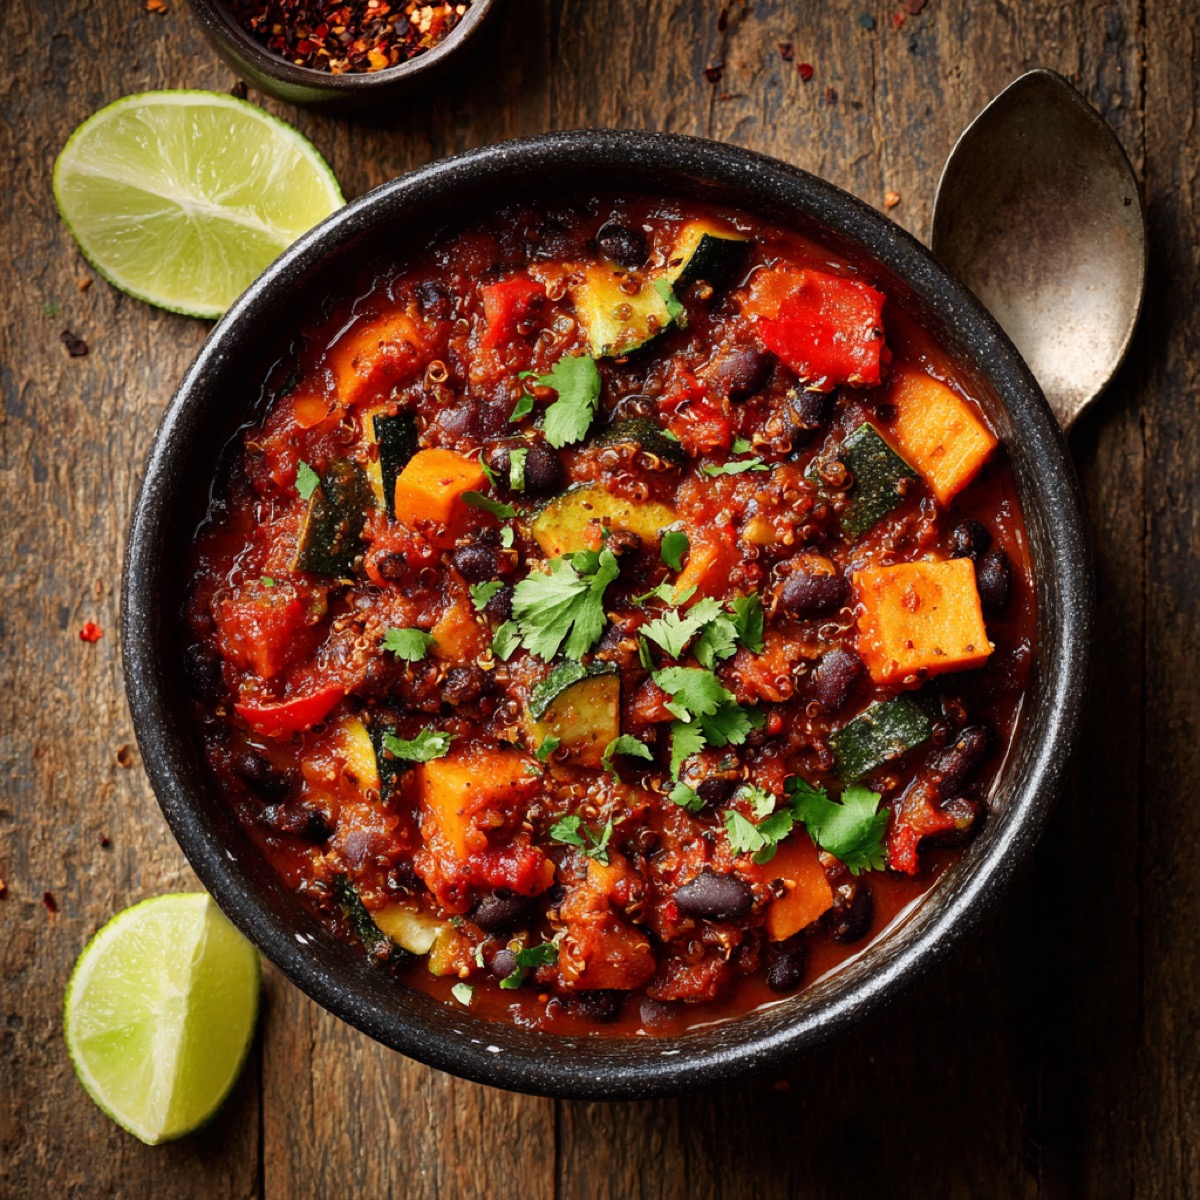
Black Bean & Sweet Potato Vegetable Chilli
A fibre-rich bean and vegetable chilli with warming spices and slow carbohydrates for steady energy and satiety.
Nutrient Tables (per 100 g)
Maps to: Brown rice, cooked, no added fat (reference variant for this table)
Core nutrients
| Nutrient | Amount per 100 g | % RDA per 100 g |
|---|---|---|
| Energy | 123 kcal | — |
| Protein | 2.4 g | — |
| Total fat | 1.1 g | — |
| Saturated fat | 0 g | — |
| Carbohydrates | 25.8 g | — |
| Fibre | 1 g | — |
Key micronutrients
| Nutrient | Amount per 100 g | % RDA per 100 g |
|---|---|---|
| Iron | 0.4 mg | 2.2% |
| Zinc | 0.6 mg | 5.7% |
| Magnesium | 39 mg | 9.3% |
| Selenium | 5 µg | 9.1% |
| Calcium | 5 mg | 0.5% |
| Potassium | 80 mg | 2.4% |
| Choline | 7.2 mg | 1.3% |
| Folate | 5 µg | 1.3% |
| Vitamin B12 | 0 µg | 0% |
| Vitamin B6 | 0.1 mg | 3.1% |
Substances
Substances in this food: editorial (Overview / literature) plus analytical (nutrition table).
10 substances in this food
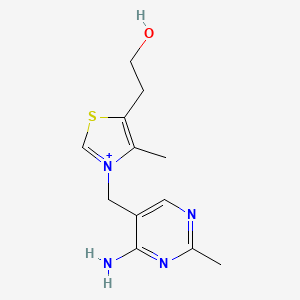
Vitamin B1 (Thiamine)
Mitochondrial glucose metabolism; ATP synthesis; rapid turnover in CNS
Iron
Oxygen transport; dopamine synthesis (tyrosine hydroxylase cofactor)
Zinc
Cofactor in neurotransmission and antioxidant enzymes; dopamine modulation
Magnesium
Enzymatic cofactor (>300 reactions); neurotransmitters; mitochondria; redox balance
Selenium
Antioxidant enzyme cofactor (GPx); supports redox balance
Calcium
Bone health; neurotransmission; interacts with vitamin D and K2
Potassium
Electrolyte for nerve transmission, muscle function, and blood pressure regulation
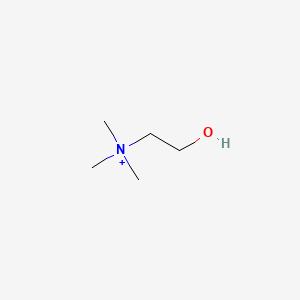
Choline
Acetylcholine precursor; methyl donor; phospholipid synthesis for membranes
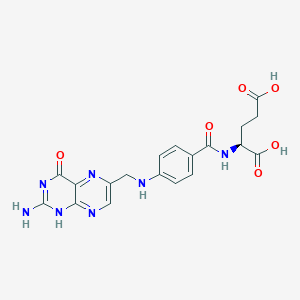
Vitamin B9 (Folate; 5-MTHF)
One-carbon metabolism; methylation; homocysteine recycling
Vitamin B6 (Pyridoxine → PLP)
PLP cofactor for neurotransmitter synthesis; relies on brain PDXK activation
References
[1] Report recommending the Digestible Indispensable Amino Acid Score (DIAAS) as the preferred method for evaluating dietary protein quality, replacing PDCAAS, and detailing methodology and implications for human nutrition. FAO 2013. Protein quality evaluation framework (DIAAS)
[2] \textlessp\textgreaterWhile animal products are rich in protein, the adequacy of dietary protein intake from vegetarian/vegan diets has long been controversial. Mariotti & Gardner 2019. Plant-protein adequacy, limiting amino acids, and practical complementarity