Green Tea

Overview
Green tea provides catechins (especially EGCG), L-theanine, and other polyphenols in a low-calorie brewed beverage. These intrinsic compounds support antioxidant defenses and are widely studied for cognitive and metabolic relevance, alongside small amounts of manganese, fluoride, and potassium from the leaf and brew matrix.
Within the BRAIN Diet framework, green tea is best used as a polyphenol beverage rather than a calorie or protein source. In Green Mediterranean Diet trials, added green-tea polyphenols contributed to greater visceral adiposity reduction than a standard Mediterranean diet alone [1], and the same trial programme linked the green-Mediterranean pattern to attenuated brain atrophy with glycemic control as part of the neuroprotective signal
Key Nutritional Highlights
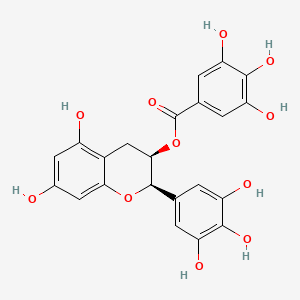
- EGCG and related catechins dominate the polyphenol profile; brew strength, leaf dose, and steep time strongly affect extraction.
- Green-tea polyphenols in the Green Mediterranean Diet were associated with greater visceral adiposity reduction than standard Mediterranean diet alone [1].
- Brain MRI follow-up in DIRECT PLUS linked the green-Mediterranean pattern to attenuated brain atrophy, with glycemic control contributing to the neuroprotective signal [2].
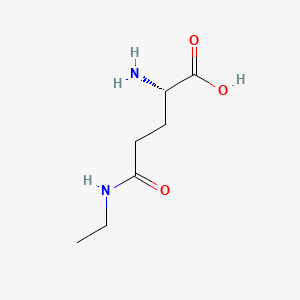
- L-theanine is a tea-specific amino acid often discussed alongside catechins for calm, non-sedating focus.
- Can reduce non-heme iron absorption when taken with meals; spacing from iron-rich meals or adding vitamin C may help.
Food Context
Synergies
- Can reduce non-heme iron absorption if taken with meals; space ≥1 hour from iron-rich meals or add lemon (vitamin C) to mitigate this.
Preparation
- Steep at lower temperatures (roughly 70–80 °C) to preserve catechins and limit bitter tannin extraction.
- Unsweetened brews fit best within polyphenol-forward dietary patterns; cup strength varies widely by leaf type and steep time.
- Adding milk to black tea did not impair catechin bioavailability in a 12-person crossover; green-tea catechins were also rapidly absorbed. This trial did not test milk with green tea [3].
Recipes
1 recipe containing this food
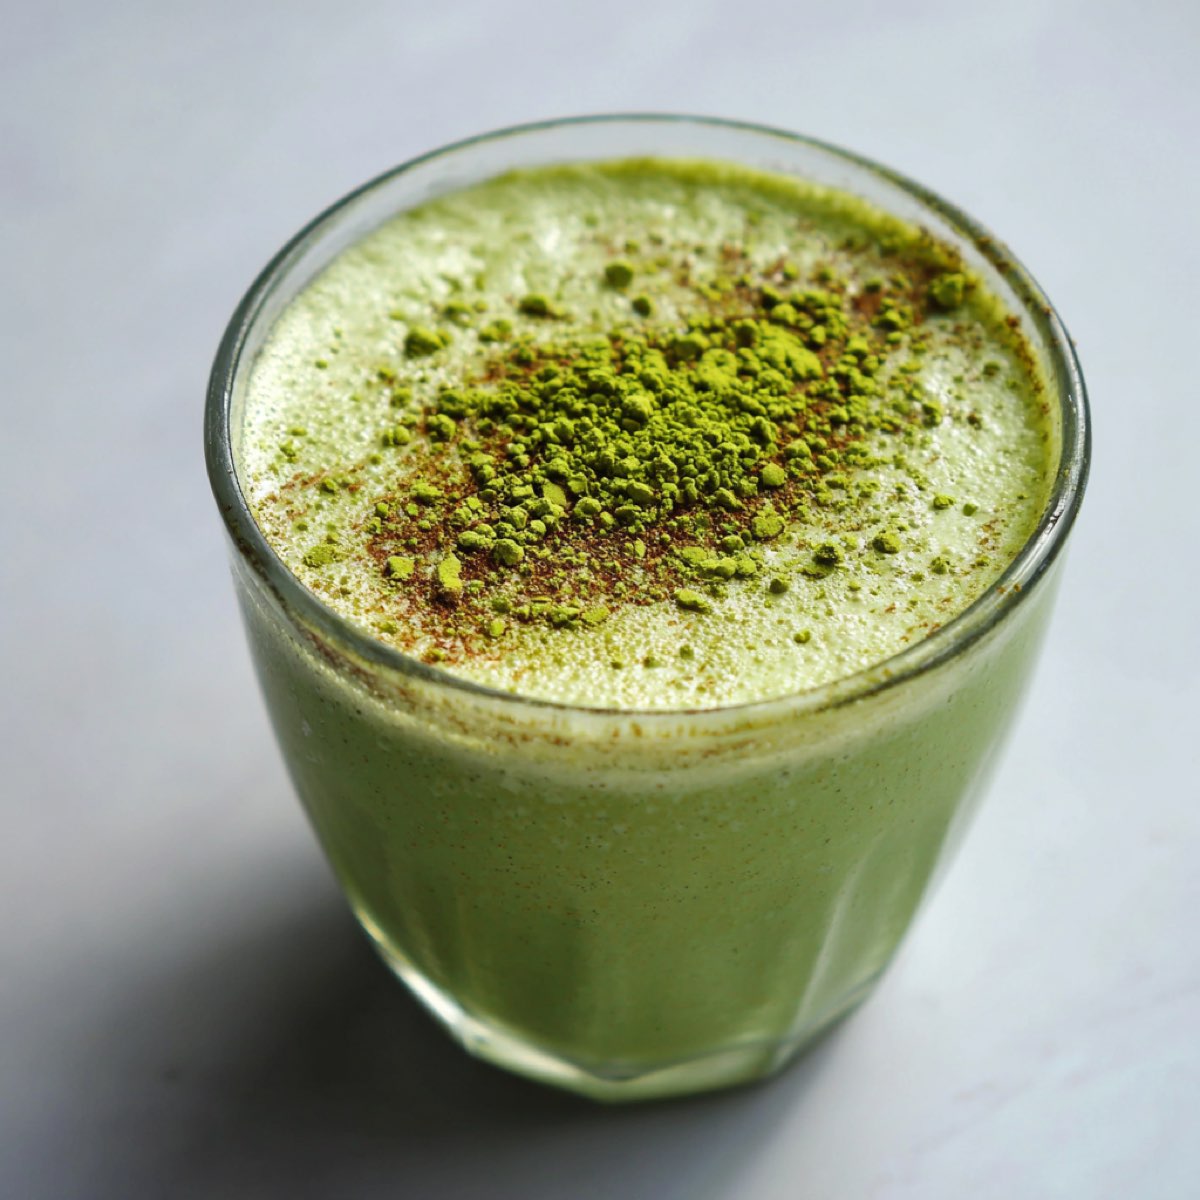
Matcha Mitochondria Smoothie
Mitochondrial energising smoothie rich in polyphenols, magnesium, and antioxidants
Nutrient Tables (per 100 g)
Selected food and preparation: Beverages, tea, green, brewed, regular. per 100 g edible portion.
Core nutrients
| Nutrient | Amount per 100 g | % reference intake per 100 g |
|---|---|---|
| Energy | 1 kcal | — |
| Protein | 0.2 g | — |
Bioactive compounds
| Compound / class | Amount per 100 g | Notes |
|---|---|---|
| EGCG | 30 mg (estimate) [4] | Dominant catechin in many green teas; very sensitive to leaf dose, time, and temperature. |
| L-Theanine | 6 mg (estimate) [5] | Tea-specific amino acid; often co-discussed with catechins for calm focus. |
- EGCG: Order-of-magnitude for a typical brewed green tea beverage scaled to per 100 g liquid; cup strength and cultivar dominate variance (USDA brew panels are not a full polyphenol spec). [4]
- L-Theanine: Approximate per 100 g brewed beverage; shade-grown teas can be higher. [5]
Technical provenance
EGCG: Order-of-magnitude for a typical brewed green tea beverage scaled to per 100 g liquid; cup strength and cultivar dominate variance (USDA brew panels are not a full polyphenol spec). [4]
L-Theanine: Approximate per 100 g brewed beverage; shade-grown teas can be higher. [5]
Functional metrics
| Metric | Score | Notes |
|---|---|---|
| Total catechins (brewed proxy) | Varies by product | Pool includes EGCG, EGC, ECG, and EC; brewing dominates extraction. |
Note: Functional-metric values depend strongly on assay method, processing, and product formulation. Use these as contextual metrics, not strict like-for-like nutrient equivalents.
Manganese varies with tea and brewing conditions. In a 2022 study, green tea brewed with 2 g leaves per 100 ml boiling water for 6–30 minutes had brewing-time means of 0.3708–0.5602 mg/100 ml (16.1–24.4% of the site’s adult Adequate Intake) [7]. A 1993 study reported 0.175–0.667 mg/100 ml in green-tea infusions under varied infusion conditions (7.6–29.0%) [8]. These are separate study results, not a universal range. Their basis is 100 ml of brewed liquid; the USDA table retains its 100 g basis.
Substances
4 substances in this food
References
[1] In Green Mediterranean Diet trials, added green-tea polyphenols contributed to greater visceral adiposity reduction than a standard Mediterranean diet alone. Zelicha et al. 2022. The effect of high-polyphenol Mediterranean diet on visceral adiposity: the DIRECT PLUS randomized controlled trial
[2] Brain MRI follow-up in DIRECT PLUS linked the green-Mediterranean pattern to attenuated brain atrophy, with glycemic control contributing to the neuroprotective signal. Pachter et al. 2024. Glycemic control contributes to the neuroprotective effects of Mediterranean and green-Mediterranean diets on brain age: the DIRECT PLUS brain-magnetic resonance imaging randomized controlled trial
[3] Randomised crossover (n = 12): green-tea and black-tea catechins rose rapidly in blood; adding 100 ml semi-skimmed milk to 600 ml black tea did not significantly change catechin AUC versus black tea alone. Milk was not tested with green tea. van het Hof et al. 1998. Bioavailability of catechins from tea: the effect of milk
[4] EFSA (2018), Scientific opinion on green tea catechins
[5] Li et al. (2022), L-Theanine: A Unique Functional Amino Acid in Tea
[7] Klepacka (2022). Tea Infusions as a Source of Phenolic Compounds in the Human Diet. Table 1 reports green-tea infusion measurements at four brewing times.
[8] Matsushima et al. (1993). Contents of Aluminum and Manganese in Tea Leaves and Tea Infusions. The publisher abstract reports the green-tea infusion range.